
This object is in archive!
chart display issue
Solved
hi menion,
small issue now in right category:
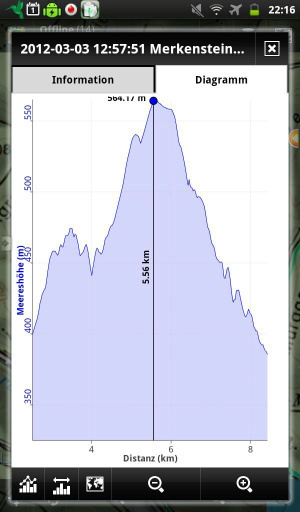
on trackchart: pls increase y- axis, if I mark the toppest point the height is not visible any more:
Files:
chart_small_inl...
 The same problem
hello Rob,
I noticed this issue from you in some other topic and it`s already solved. When text is in top part of screen, I shift it little bit lower and opposite
hello Rob,
I noticed this issue from you in some other topic and it`s already solved. When text is in top part of screen, I shift it little bit lower and opposite
Consider-
Instead of trying to label within the graph, a dynamic digital readout at the bottom for cursor distance and altitude-
Consider-
Instead of trying to label within the graph, a dynamic digital readout at the bottom for cursor distance and altitude-
Hmm. Altitude 564.17 m?
Two numbers to right of decimal point implies vertical accuracy to one onehundredth of a meter. Simply not possible. Number should be truncated. Even one meter accuracy is impossible in vertical.
Hmm. Altitude 564.17 m?
Two numbers to right of decimal point implies vertical accuracy to one onehundredth of a meter. Simply not possible. Number should be truncated. Even one meter accuracy is impossible in vertical.
hmm at first moment I wanted to say that you`re correct, but on second I have to say no to this. For all altitude formatting, I use same function. And I don`t know if source of altitude is from track record, or you manually added, or if you for example saved geodetic leveling point with very precise altitude ...
hmm at first moment I wanted to say that you`re correct, but on second I have to say no to this. For all altitude formatting, I use same function. And I don`t know if source of altitude is from track record, or you manually added, or if you for example saved geodetic leveling point with very precise altitude ...
Ahh! I forgot about manual entries from surveyors!
Ahh! I forgot about manual entries from surveyors!
Even if altitude is entered manually it doesn`t make sense to talk about cm accuracy. Integer meter values, please. Even horizontally it doesn`t make sense to talk about sub-meter accuracy. We are out in mother nature, right? We are not building a house with this tool.
Similar for speed. Should be max 1 digit after the decimal point..
One interference issue with chart though:The time or speed label is always at the middle of the vertical line. If selected point on graph is half-way up too, the two labels overlap.
You metric guys must be LYAO at starman for saying "one onehundredth of a meter". I should have said "centimeter"! :-)
But you are right svartbjorn, the graph is just a simple "howgozit" chart.
You metric guys must be LYAO at starman for saying "one onehundredth of a meter". I should have said "centimeter"! :-)
But you are right svartbjorn, the graph is just a simple "howgozit" chart.
hmm on all places in application I use for altitude integer units and for speed one decimal place so may someone tell me why I used in Chart screen different system and also why I argue with precision needed for surveyors? Hmm .. changed to everywhere used units precission as you mentioned Svartbjorn ..
What you mean by "howgozit" chart Starman? :)
about labels. I improved it a little but it`s still not perfect. Also displaying of additional points of track on chart is not perfect so it`ll still need some improvements in future
I would like to say THANK YOU, Menion, for the great new chart features and layout. Font size is now good, and being able to move between points on chart and map is really great. Yes, you deserve a big thank you, Menion!
I would like to say THANK YOU, Menion, for the great new chart features and layout. Font size is now good, and being able to move between points on chart and map is really great. Yes, you deserve a big thank you, Menion!
I was thinking about it, but image small display with landscape mode ... chart itself will then have 1 cm :)
I was thinking about it, but image small display with landscape mode ... chart itself will then have 1 cm :)
good. There is still place for improvements as I wrote, but this next time :)
good. There is still place for improvements as I wrote, but this next time :)
Replies have been locked on this page!