
Weather forecast: perception displayed inconsistently
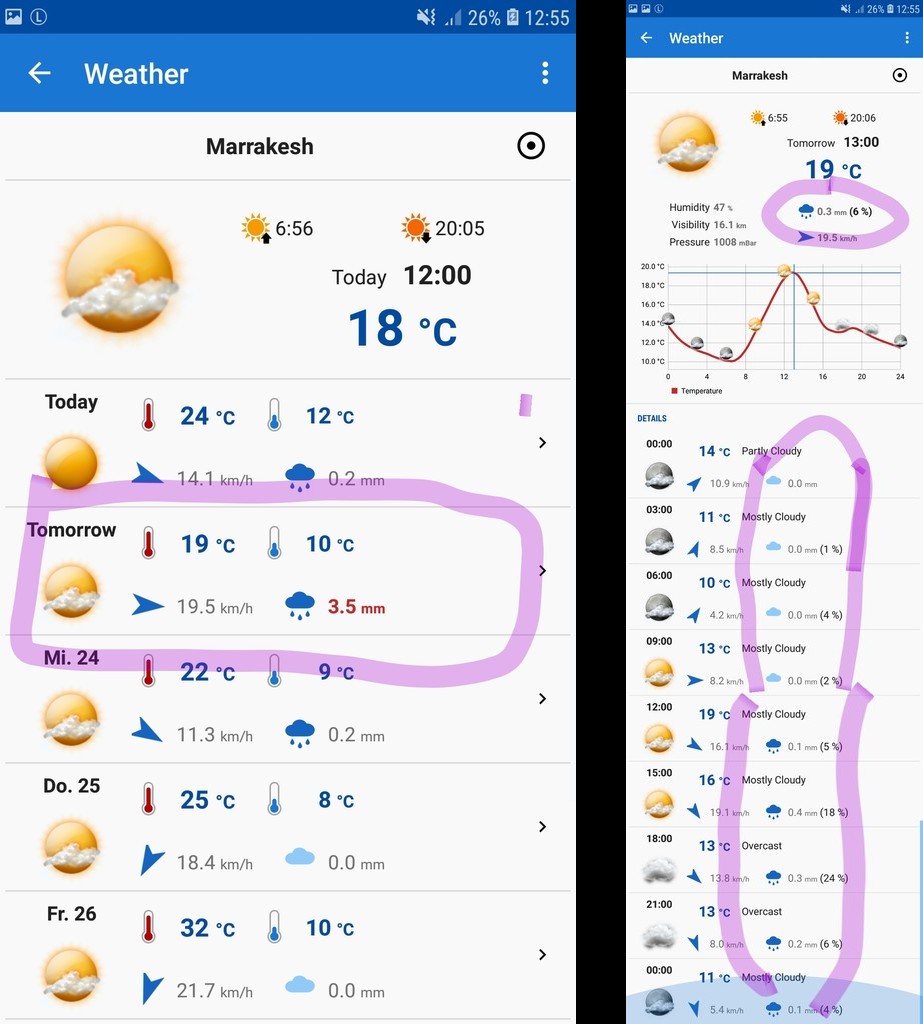
In the weather forecast, the perception calculation is broken. Mostly, the daily amount is much higher (left part of screenshot) than the sum of the detailed perception amounts (right part of screenshot, lower marked area).
Hans-Peter Schöner wrote a possible explanation in https://help.locusmap.eu/topic/weather-forecast-also-show-rain-and-cloud-probability: "the daily forecast shows the daily total rainfall in mm - fine. The detailed weather forecast of the day has three hour steps: fine for temperature, but the rain is given for only the hour displayed in mm. You might miss significant precipitation in the two hours in between. Stepping through the graphics shows that the hourly data is available for all single hours. But this way it is quite hard to retrieve it.
My proposal: give the rainfall with a unit including the time span, like on the daily screen in X mm/day , in the 3 hour steps either with X mm/3h (as the sum of the following three hours) or X mm/h (as the average of the following three hours). In addition a graphic representation (blue blocks per hour with the hourly rain forecast) together with the red temperature curve would be quite intuitive. The rain probability could be shown by the colour intensity of the blue rain blocks." The last piece (rain probability) is not yet shown at all, see idea https://help.locusmap.eu/topic/weather-forecast-also-show-rain-and-cloud-probability
 The same problem
Hello Georg D,
unfortunately, the DarkSky service we use for forecast was purchased by the Apple company and will be terminated at the end of 2021. So for now, we do not plan any updates. I'll keep this "issue" open because I believe, it will be useful (thanks for it) once we found and switch the forecast to a new service this year.
Menion
Hi @Menion Did the switch of weather forcast provider already happen? 😀
Hi @Menion Did the switch of weather forcast provider already happen? 😀
Hi Georg,
I've received small Christmas gift (because I've noticed this info in December) :)
---
So let's solve this issue now ...
Hope this will be more clear.
- rain intensity is a sum from 3 hours (current + next two)
- rain probability is average from 3 hours
- wind intensity is max. value from 3 hours
Menion
Replies have been locked on this page!