
Slope Values Inaccurate
I often make use of the slope data in Locus, using the elevation chart and line coloring.
I increasingly get the impression that the slope calculation is inaccurate/faulty. Esp. zig-zag trails appear steeper on the map than they actually are in reality. Since zig-zag trails run along the altitude lines they certainly have to be less steep than the slope of the hill itself.
Looking on the elevation chart I realized that the slope never changes abruptly (going from flat terrain to steep down), but always looks smoothened. I guess that the slope calculation algorithms does some kind of averaging. In the case of zig-zag routes something might add up incorrectly.
Could someone take a look at it and find out why slope values might be too extreme for such kind of routes? Perhaps Locus smoothens the route for slope calculation and thus these short zig-zag turns get lost?
 The same question
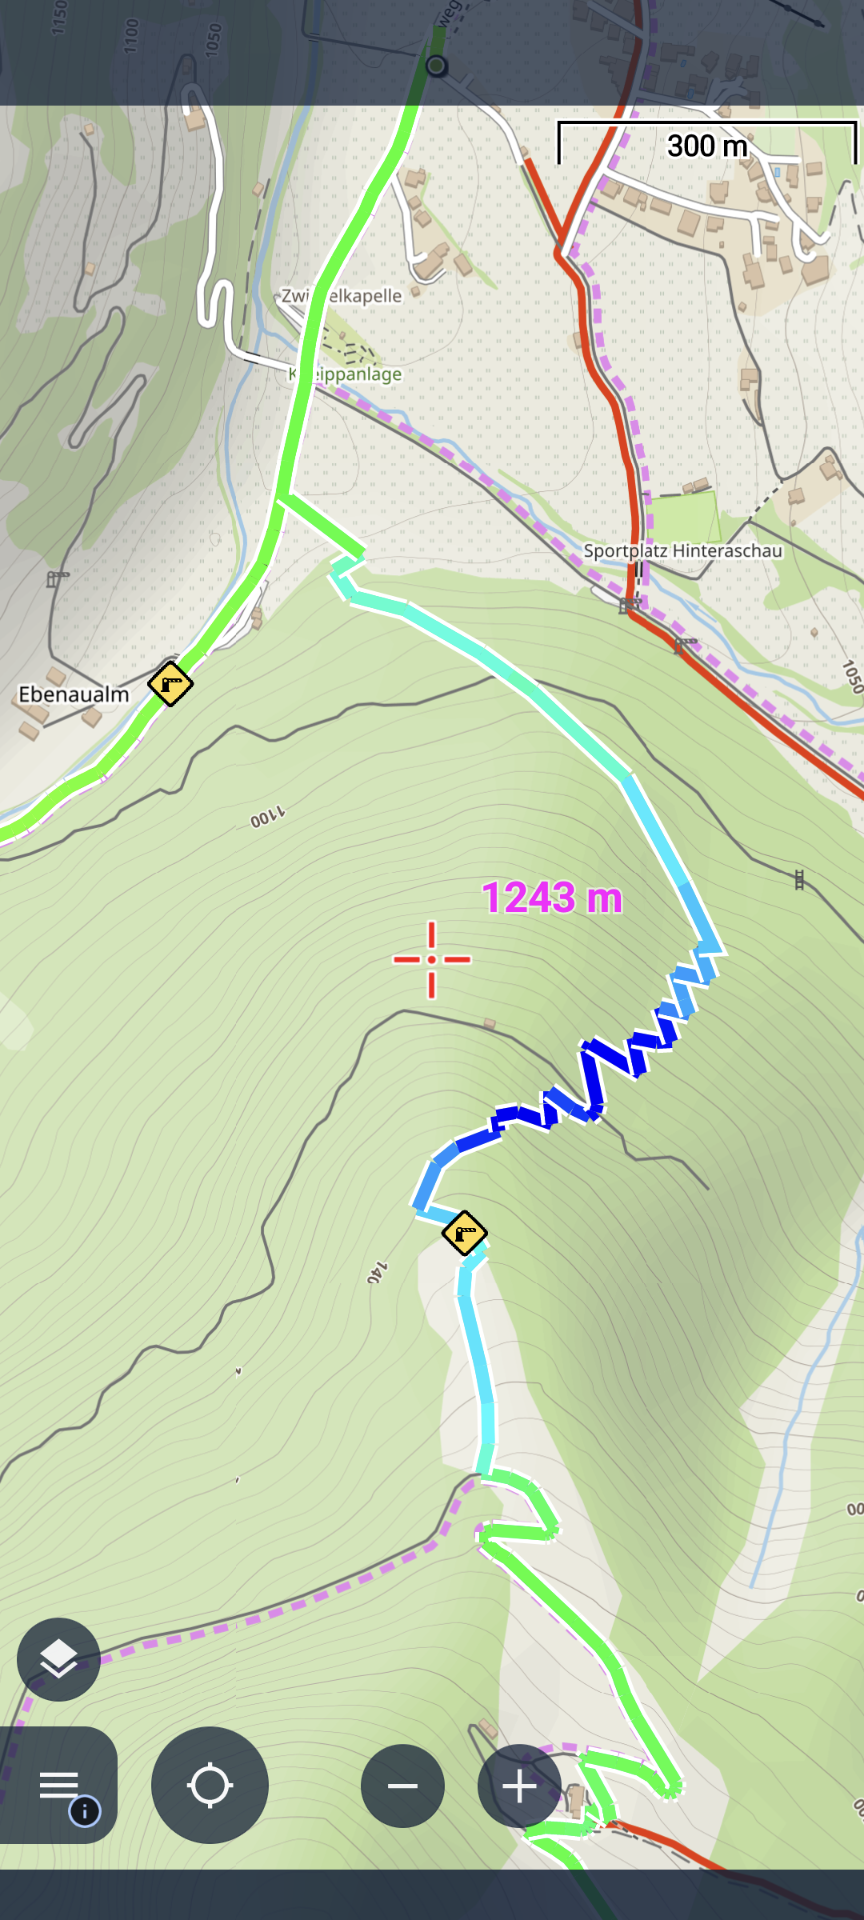
Hi. You are right. If the slope were to go up or down in a straight line it would be very steep but zig zags are not.
Hi. You are right. If the slope were to go up or down in a straight line it would be very steep but zig zags are not.
Hi guys,
kick me please, but I do not see a problem on your screenshots. On Martin's screenshot, based on the contour lines, there is a big downhill, so the slope color is close to dark blue. On the Agus screenshot, there is an uphill also on the zig-zag route so the slope changes closer to the red.
App by default uses an automatic slope coloring range. This means that the lowest and highest slope values are calculated, and color is interpolated based on this range. I may suggest setting a custom manual range. It may help to really see a potential problem. Also, slope values may be checked on the track chart - an identical algorithm is used to optimize the chart and color on the map.
Hi Menion,
I agree that the coloring on our images doesn't look suspicious. But in reality zig-zagtrails don't feel that steep, in comparison to straight trails. However that's hard to prove. Perhaps, the track data is inaccurate and the zig-zag lines are longer in reality, but when recorded with GPS the corners get cut and each zig-zag-ramp ends up x-meters shorter on the map ‒ which makes a substantial difference if each zig-zag-ramp is only 10m long. Plus, zig-zags on the map have a low resolution (meaning few points) and sharp corners (while in reality they are round).
P.S.: I came to my mind, that I use high-res elevation data (from Sonny), and this could be a problem too!? Here is a comparison with slope-coloring (-40% <> + 30%). Left High-res and Right Standard.
@Menion thanks for the info that the coloring is using the same slope data as shown in the elevation chart. I'll look onto these numbers, instead of the line coloring!
Replies have been locked on this page!