
Speeds on web planner - comparing statistics and chart are inconsistent
Known
Referring to this recorded track the chart shows a maximum speed of 10.0km/h. Visually (by eye) you would say the average is maybe 9.5km/h
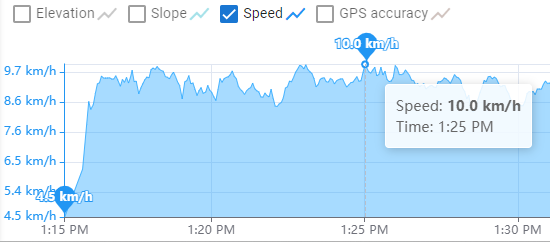
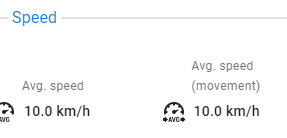
but the statistics show an average of 10.0km/h. One or the other must be wrong.
And the statistics also show a maximum of 11.2km/h, which is inconsistent with the chart's maximum of 10.0 (10% error):
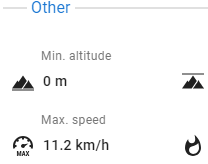
If I import the GPX into Garmin Basecamp, extract the data as a CSV, then import into a spreadsheet, the average is close to 10km/h and the maximum around 13:25 seems about right too at 11km/h. My guess is the chart is wrong, by a significant (10%) amount, and the statistics are correct.
 The same problem
Hi Andrew,
thank you for your question. The difference you can see between data in chart and statistics is caused by the smoothing filter applied only to the visualized chart data.
Kind regards, Ondrej
Hi Andrew,
thank you for your question. The difference you can see between data in chart and statistics is caused by the smoothing filter applied only to the visualized chart data.
Kind regards, Ondrej
Thanks Ondrej. I guess it probably was. But at very least unnecessary inconsistency between
Thanks Ondrej. I guess it probably was. But at very least unnecessary inconsistency between
Replies have been locked on this page!