
GPS accuracy in the chart
Completed
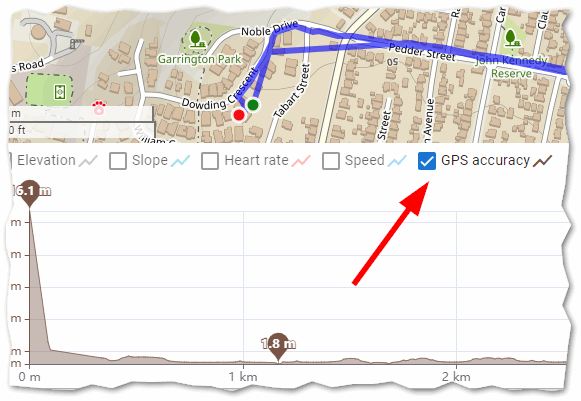
There is one minor function that is better in the Web Planner than LM4 - display of GPS accuracy in chart. LM4 can display everything else but GPS accuracy:
It's one one minor function where the Web Planner is better ;-)
 I like this idea
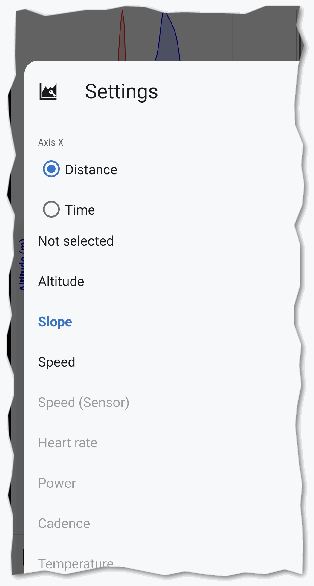
In new charts (introduced in v4.33) accuracy not available as of v4.34.1. I would like to see accuracy so I can more easily distinguish "real" spikes in speed or altitude from "false" / "artificial" spikes that did not happen in physical movement but have been introduced by technical issues, e.g. bad position in a narrow valley.
I'm not sure I want to have accuracy only as a dedicated chart – then, all graphs need so much vertical space they don't fit on one screen (see idea "compact view"), so I cannot see accuracy and the other graphs at once. I think I would prefer an option to color-code all charts by accuracy. Having both (dedicated diagram as well as color-coding option) would be even better.
Good news — you'll be able to add GPS accuracy as a chart curve in the track detail/chart screen, just like altitude or speed. It's included in an upcoming 4.34.x update.
Coloring charts by accuracy is a separate idea and I'm really not sure, it worth it.
Good news — you'll be able to add GPS accuracy as a chart curve in the track detail/chart screen, just like altitude or speed. It's included in an upcoming 4.34.x update.
Coloring charts by accuracy is a separate idea and I'm really not sure, it worth it.
"good enough"
"good enough"
Replies have been locked on this page!