
Question about the diagrams relating to editing a track
I have a question about the diagrams relating to editing a track.
I recorded a walk. At one point, I took the bus for a short while and then continued on foot.
Using the Track Editor, I can cut out the bus section. The map then initially shows the cut-out section connected by a straight line. If I then insert a pause, the track is displayed on the map exactly as I want it: walking section 1, gap, walking section 2 (see Fig. 1).
The diagram joins the two walking sections together (there is only a tiny gap). The cut-out bus section is ignored. Of course, this usually makes sense. (Fig. 2)
However, I would like the cut-out section to appear in full on the diagram (as it does on the map). As shown in the mock-up in Fig. 3. Is there any way to do this?
 The same question
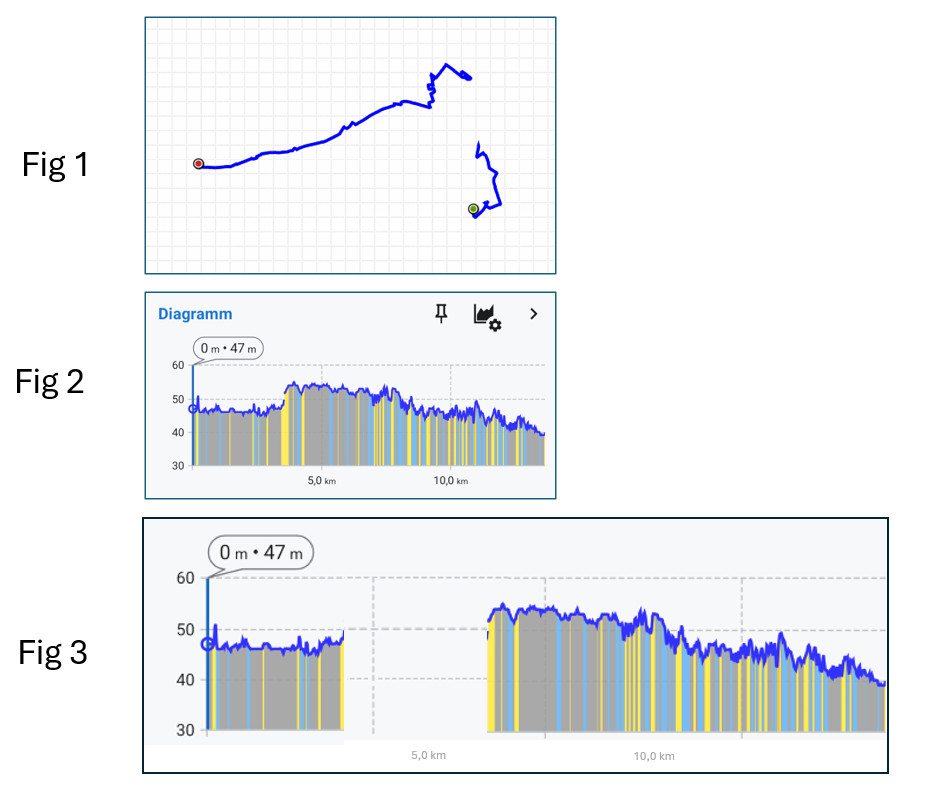
Hi,
switch the X axis to "time," and you'll get what you need.
Hi,
switch the X axis to "time," and you'll get what you need.
Replies have been locked on this page!