
Accumulated uphill/downhill on recorded track far off
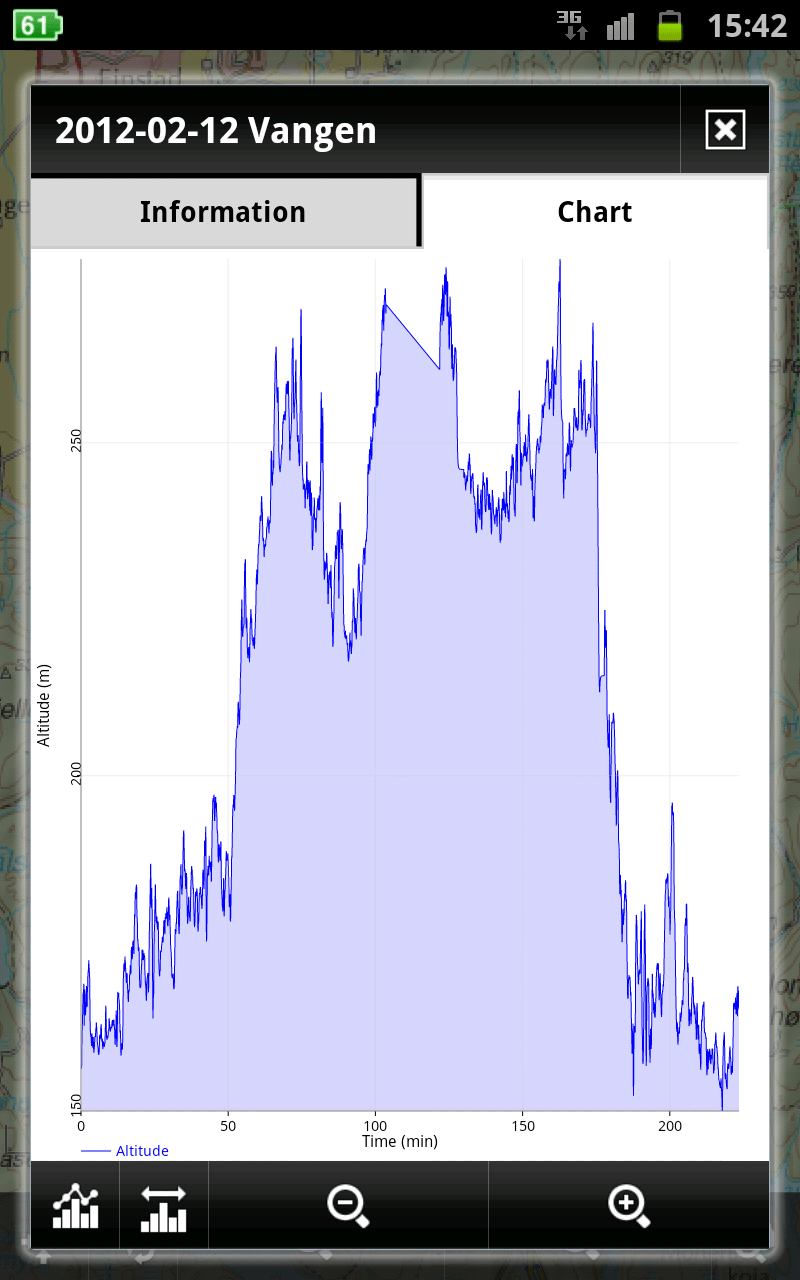
This has been a topic before. A new menu entry was added: "GPS and location" > "Altitude filter". I have selected "Heavy filter". Even then the accumulated uphill/downhill elevation on recorded tracks is completely wrong. The example image attached has the following settings:
"Track recording" > "Interval (seconds)" = 1s
"Track recording" > "Interval (metres)" = 5m
"Track recording" > "Recording conditions" = One
"GPS and location" > "GPS auto-off" = disabled
The trip was in a pretty flat landscape, and partly on lakes. As you can see, the graph is very noisy. Even on the lakes, it is very noisy. All that noise causes the accumulated uphill/downhill to become extremely big and completely wrong. So either the "Heavy filter" is not strong enough, or the algorithm doesn`t work (or I have missed something?). I have the gpx file, but can`t find a way to attach it here. I can send as email if you want it.
Another strange thing: even though I have "Interval (seconds)" = 1s, the recorded track of 3h25min only contains 8081 points. I had expected 205 min x 60 x 1 = 12300 points. Why this difference?
 The same problem
Hi,
For the last question about count of points, i had a quick idea, but not sure. Maybe you are using the option "only record points during movement"? So when you don`t move, no point will be recorded and this may explain the missing 4.000 points.
Cheers
Hi,
For the last question about count of points, i had a quick idea, but not sure. Maybe you are using the option "only record points during movement"? So when you don`t move, no point will be recorded and this may explain the missing 4.000 points.
Cheers
No, I have that disabled.
No, I have that disabled.
hmm about recorded points ... I think this can be cause also by one thing. GPS return values in 1s interval. But this do not have to be precise. It should be less or more. By more I mean also 1001ms and this value will not fit 1s interval - so it`s one point out. Suggest to set 0s which will for sure take all points
about altitude. Yes, it`s a long story :). What about signal quality (many trees above) and Pressure sensor (disabled)? GPX track is nice but quite unusable for testing. Best for improving altitude are raw data. So if you`ll plan some similar trip soon, enable NMEA recording in Locus. This will store all raw data from GPS and I`ll be then able to perfectly test and simulate your whole trip in same conditions as you.
and last thing. You say "quite noisy". Yes, but when I look on scale, trip was really looong and when you record data every second, there is really a lot of data. GPS precision in altitude is around 10m in good conditions and change a lot so even a heavy filter may cause ... this
I am skiing home from work now through the forest and will get 1 hour of recording. I have now set Interval = 0s (just to check out number of points), and turned on NMEA recording. I have still "Enable pressure sensor" disabled, since it requires calibration to make sense (to my understanding).
Regarding GPS signal quality: there are trees, but this is not a dense forest. And even the part on open lakes were just as noisy.And Samsung Galaxy Note also tracks the Russian GLONASS satellites, and I see very high sensitivity and impressive accuracy on this phone.
More on altitude noise: I used MyTracks before I discovered Locus, and the altitude graph there was very smooth.
You are skiing home from work?
What a nice job ;)
You are skiing home from work?
What a nice job ;)
Yes. My house is next to a large forest area and my company is located at the other side. So there are 10.5km skiing. In the summer time I bike, run ot go by kajakk (there are two lakes I cross). And all this is just 15km from downtown of Norway`s capital Oslo. My work place is actually inside the area of Oslo, while I live just outside the city limit.
Yes. My house is next to a large forest area and my company is located at the other side. So there are 10.5km skiing. In the summer time I bike, run ot go by kajakk (there are two lakes I cross). And all this is just 15km from downtown of Norway`s capital Oslo. My work place is actually inside the area of Oslo, while I live just outside the city limit.
Menion,
I just sent you the track as email. With "Interval" = 0s, number of stored points = # of seconds. So that confirms your explanation why I store less points than one/sec even though Interval = 1s.
Menion,
I just sent you the track as email. With "Interval" = 0s, number of stored points = # of seconds. So that confirms your explanation why I store less points than one/sec even though Interval = 1s.
best is to compare results on same tracks (thanks to NMEA file)
below are four images. First two are results with disable Altitude filter. Next two are with enabled altitude heavy filter. You think that second result is not good, should be better?
best is to compare results on same tracks (thanks to NMEA file)
below are four images. First two are results with disable Altitude filter. Next two are with enabled altitude heavy filter. You think that second result is not good, should be better?
Thank you for analyzing. The bottom graph (with Heavy Filter) is identical to what I see when I display the recorded track (recorded with Heavy Filter) - as expected. Is this good enough? Well, look at the track between 1.7-2.9km. That part is on a lake and should be completely flat. Due to GPS inaccuracy the graph is instead quite noisy with 3 spikes and you can see that they accumulate to 30m uphill and 30m downhill - just at a distance of 2.9-1.7 = 1.2km, that is 2.5%. May be it is not possible to filter harder? I understand this is always a compromise. But in the MyTrack days, I am pretty sure to remember quite smooth graphs, i.e. even harder filtering I guess. Ok - may be what you are doing is the best that is possible given the nature of vertical gps accuracy. I just wondered if it were any way to improve it further. Thank you anyway for looking into this topic - again (I remember we discussed it a long time ago, with the result that you implemented these user selectable filters. Great).
Thank you for analyzing. The bottom graph (with Heavy Filter) is identical to what I see when I display the recorded track (recorded with Heavy Filter) - as expected. Is this good enough? Well, look at the track between 1.7-2.9km. That part is on a lake and should be completely flat. Due to GPS inaccuracy the graph is instead quite noisy with 3 spikes and you can see that they accumulate to 30m uphill and 30m downhill - just at a distance of 2.9-1.7 = 1.2km, that is 2.5%. May be it is not possible to filter harder? I understand this is always a compromise. But in the MyTrack days, I am pretty sure to remember quite smooth graphs, i.e. even harder filtering I guess. Ok - may be what you are doing is the best that is possible given the nature of vertical gps accuracy. I just wondered if it were any way to improve it further. Thank you anyway for looking into this topic - again (I remember we discussed it a long time ago, with the result that you implemented these user selectable filters. Great).
everything is possible :) problem for me in some filtering, is to determine what is real and true value and what is only a noise. Maybe solution should be to improve filter to apply strength depend on accuracy value.
anyway one thing to test. Your phone support Pressure sensor right? It should improve altitude values a lot. There is no need for some excellent knowledge (also this sensor is not yet well tested so mistakes are expected) so:
when you`ll be on start of your way, enable GPS, wait for fix and then ...
1. go to settings > sensors
2. check enable pressure sensor
3. go below to "Calibration"
4. click on "Altitude" and instead of setting value, click on right on icon and select GPS. This will take current pressure and calibrate it to current altitude value
5. and go ...
result of this will be - maybe less precise absolute value of altitude, but should be much more smooth relative value. This cannot be anyway tested at home and I personally do not used this pressure sensor outside yet so results should be ... weird :) good luck
and last thing ... Ultra is ultra :) (new filter option just for you)
and last thing ... Ultra is ultra :) (new filter option just for you)
I`ll be travelling for some days. I`ll give it a try when I am back next week.
I`ll be travelling for some days. I`ll give it a try when I am back next week.
Hi again. Didn`t see your Ultra Filter first time. Yes, that looks really good!! That is exactly how it should look. I am assuming this filter option will be part of the standard selction in the next Locus release? I would think most people will find that to be the most optimum filter. Great! Thanks a lot, Menion!
Hi again. Didn`t see your Ultra Filter first time. Yes, that looks really good!! That is exactly how it should look. I am assuming this filter option will be part of the standard selction in the next Locus release? I would think most people will find that to be the most optimum filter. Great! Thanks a lot, Menion!
Hi svartbjorn-
I took the liberty of downloading the manual for your Samsung Galaxy Note. That is an impressive device. Like you stated, it`s GPS chip can also utilize the GLONASS system. Besides the usual compass, it also has a barometer and an ACCELEROMETER and GYRO.
There is a setting, SETTINGS> LOCATION and SECURITY> USE SENSOR AIDING, where, under certain conditions, the output of the accelerometer and the gyro can be incorporated into the position solution.
Since the device is on your person, while engaged in the vigorous activity of skiing, perhaps that is the source of all the altitude noise.
I suggest unchecking that setting and repeating your tests with normal altitude filtering, to see if it makes a difference.
Regards,
Starman
HTC EVO 4G
Locus Pro
"Use sensor aiding" is unchecked. So that is not the source. But that you for your suggestion.
"Use sensor aiding" is unchecked. So that is not the source. But that you for your suggestion.
I have tried "Use sensor aiding" with Calibration=Automatic on three different trips now:
1-2) Skiing to work (first time I turned on "Use sensor aiding"). It had troouble of calibrating, starting off at an elevation 100m too high, then 5 minutes later making a 100m sudden jump down, another 5 minutes later jumping up 80m and the rest of the track was at 80m too high elevation. May be it would be better to use Calibration with Altitude set manually? On my way home following the same route in opposite direction, the vertical track was correct and very smooth with very little noise.
3) Walking in the Alps, starting at 1600m, cllimbing up to 1990m, with "Use sensor aiding" = off, and same way down with "Use sensor aiding" = on. See attached picture. Looks really good and correct with "Use sensor aiding" = on.
The "Use sensor aiding" seems to be working fine if Calibration is set manually (set altitude). Automatic calibration doesn`t seem to quite to trust. Since most phones do not have a pressure sensor, your new Ultra Heavy filter should be what most users will appreciate.
Interesting data svartbjorn, especially since it contradicts my earlier suggestion that the Sensor Aiding feature might be the source of the altitude noise! Obviously a different algorithm is used in the solution with sensor aiding, which acts as a stronger filter. Interesting stuff.
Interesting data svartbjorn, especially since it contradicts my earlier suggestion that the Sensor Aiding feature might be the source of the altitude noise! Obviously a different algorithm is used in the solution with sensor aiding, which acts as a stronger filter. Interesting stuff.
Another interesting observation: as you can see from the chart above, total distance = 6.7km about. However, the "Information" tab of the same track says Length = 7.9km. Also I have the saved point "Point 1", which was saved when the recording said distance = 4km. On the chart above it is at distance 3.2km or so.
--> So why are the "Chart distance" different from the "Information distance"?
--> Does the "distance" take the path angle into account or is it the horizontal projection only? (think you have covered this question before somewhere, but I can`t find it.)
--> Could you please step up the font size on both axis? It is really hard to read on the phone, even on my big 5.3" Galaxy Note screen. The grid lines are also very weak and hard to see outdoors.
I had a skiing trip today and did the following:
- I used Locus with recording and the following settings;
-- Track recording conditions: interval 3s AND interval 10m
-- GPS altitude filter = Ultra heavy
-- Enabled pressure sensor with manual calibration to know altitude
- I also used a baro watch where I calibrated altitude manually. The watch has a baro recording that accumulates uphill/downhill very accurately.
After the test trip the watch showed accumupated uphill = 80m, downhill =-250m.
The attached screen shots from Locus, shows:
- Information page: uphill = 29m, downhill = -128m
- Graph page: my adding the uphill and downhill changes manually from the graph, I found accumulated upphill = 75m, dowhill = -230m
Conclusion: Locus graph display matches perfectly with the baro watch recording. Locus information page shows completely different data than the graph page (about the half). Both pages are created from the same recorded track data, so why are they so different?
hi,
so seems you`re satisfied with ultra heavy filter, good :))
about values. It`s quite simple. What is flat and what is uphill or downhill? There have to be some break points for this. I`m using value "declivity" (elevation / distance) and break point is 5%
truth is, when I look on your values, that you have difference between top and bottom place almost 200m, but downhill is only 128m. Quite interesting is value for flat elevation. May you export this track to GPX and share it with me? I`ll look at it closer, thanks
GPX track sent my email.
I remember we discussed the 5% break point a long time ago. At that time we have trouble with the noisy altitude data. Now, with your new Ultra heavy filter, may be the break point could/should be lower?
GPX track sent my email.
I remember we discussed the 5% break point a long time ago. At that time we have trouble with the noisy altitude data. Now, with your new Ultra heavy filter, may be the break point could/should be lower?
Oslo is 60deg N latitude. Doesn`t VDOP and altitude noise decrease as you move south? It would be interesting to repeat this at a lower latitude, say 30deg N. (Where I am located, 45deg N, there are no hills). Perhaps not as strong filtering would be required. Although since your phone also uses GLONASS, it may be achieving a low VDOP at that high latitude.
Oslo is 60deg N latitude. Doesn`t VDOP and altitude noise decrease as you move south? It would be interesting to repeat this at a lower latitude, say 30deg N. (Where I am located, 45deg N, there are no hills). Perhaps not as strong filtering would be required. Although since your phone also uses GLONASS, it may be achieving a low VDOP at that high latitude.
Hello Bjorn,
so much reports, thanks :)
- so firstly, you don`t have access to dropbox for testing versions right? So invitation send .. (new testing version is uploading)
- wrong distance in charts, sorry my mistake, should be fixed
- about elevations ... it`s not so simple to change 5% value because many people will not use ultra heavy filter. Anyway when you`re moving faster, altitude should have "higher precision" compare to distance change so when you move faster (more then 5km/h), value will be 2%. Results are better now
What about having 5% for Heavy filter and less and 2% for Ultra Heavy filter? That could be automatic, hidden from user. Or user selectable?
A bit larger font size on the graph would be great.
Dropbox invitation accepted and test version 2.0.2.1 installed. I`ll try it out tomorrow (Monday) when I run to work.
I tested version 2.0.2.1 today running to and from work.
Settings:
- Altitude correction = NMEA
- Altitude filter = Ultra heavy
- Pressure sensor = disabled
I logged also with my baro watch. Also at home I followed the track on the map with "Dynamic Altitude" enabled and manually calculated accumulated uphill/downhill. Here are the results:
-- Locus Information: +100/-200 - both ways!!! (just 10m lower for the other way)
-- Baro watch: +190/-290
-- Manually calculated from map: +160/-260
Conclusions:
==========
-- Baro watch seems very accurate compared to manually calculated, (which will miss some meters up and down), so we can use that as a reference.
-- Locus is missing some meters, which most likely is due to the 5% break point that defines uphill/downhill. WHICH IS FINE! There has to be some sort of criteria. The baro watch accumulates every small change, so when the terrain changes up and down constantly, it will accumulate differences that Locus may decide is flat. WHICH HAS TO BE THAT WAY!
-- I kept an eye on the baro watch to see how much is actually 5% elevation change. 5% SEEMS TO BE A VERY REASONABLE BREAK POINT!
-- Graph observation: I put the two graphs (to work, and same track from work) into a graphic editor and mirrored one of them so they were easy to compare side by side. They both look very nice with Ultra heavy filter. However, they differ on some peaks and valleys with typically 10m, some as much as 30m. But that is probably within the vertical accuracy we can expect?
Question:
=======
-- Are you sure the manual correction is working in the new Altitude correction menu? I used -40m before, which gave a very good match. However, this mornign when I tried NMEA vs Manual, NMEA seemed accurate, but Manual didn`t seem to make any correction any more, so I got altitude 40m too high. Please check this entry.
-- Repeating a wish: please increase the font size by 50% on th graph- Even on my large, high resolution Galaxy Note screen, the labels are really hard to read. Also the grid lines are hard to see.
damn, you cannot say me, to just simply change one small thing like text size. Result is that I discover things that need change and I don`t had time (or I don`t wanted) before ...
in this case, result is that (also because seems like Chart library I use is not so much actively developed now) I`m trying to understand this chart library. So zoom +/- buttons are now correctly working. You can also tap on chart do display values and then tap on bottom map button, to move on map on specific place. I`ll also add some indication of closest point on chart to current location and yes .. text sizes :)
so still enough work for today (together with some testing). I believe it will worth it ...
and yes, about Altitude correction. When I enable GPS, without manual correction I see around 300m, when I set 40m, I see 260m, so I think it`s working ...
Here are the two graphs put together. One is the track to work in the morning, the other one is home from work the exactly same path. For easy comparison I have mirrored one of them. Also I had to slight adjust one of them to match the vertical scale. Largest difference is 25m.This is very good, I think. Do you agree?
==> Regarding manual altitude correction in test version 2.0.2.1: the sign must have changed. I have tonight done several tests with Locus Pro 2.0.2 vs Locus Free 2.0.2.1. -40m on Locus Pro REDUCES altitude with 40m. -40m on Locus Free INCREASES altitude with 40m.
perfect, I also think that this is nice result. So ultra heavy filter seems to be your choice :). Anyway, it`s always chance to "fill altitude" from SRTM files now, in case of terrible recording result
and about altitude, you`re probably correct. Sign was changed accidentally during my update. So fixed back to old behavior
So, I think ... problem solved? (finally) :)
Problem solved! Definitely! This is really usable and to trust now.
Two questions - Information page of a track:
- why is Flat/Elevation a number different from 0?
- what is Total/Elevation? Is is not uphill+downhill+flat (not even when adding the absolute values, i.e. all as positive numbers), so ...?
perfect
about questions. I don`t know what are best behaviours so it`s on discussion. Flat value is accumulated sum of flat segments. But these altitudes aren`t exactly `0`, so this is result. This is also answer on second part.
Imagine track. Total evevation is 500m. Uphill (declivity more then 5%) should be 300m, downhill (declivity below -5%) should be 150m and then segments with declivity between -5% to +5% gives together elevation 50m. And sum of these values is number next to "Flat/elevation". Anyway value `0` should be less confusing probably ...
Flat/Elevation:
==========
You are saying that Flat is accumulation of all segments that fall within +-5% declivity? Does that make sense? If you accumulate these elevation changes, you are NOT defining those as "flat" after all. Isn`t the whole point with the +-5% that if elevation change is within these limits, then we per definition can`t say if that is a true change or a change due to GPS vertical inaccuracy? Hence that is classified as "flat", which means 0m change. So accumulation should then also per definition be 0, i.e. Flat/Elevation should per definition always read 0. Right?
Total/Elevation:
===========
You explanation is what I thought it would mean, but if you look at the 4 examples of Information screens above, none of them accumulate as you are saying. "Total" is of interest, but it is just not calculated correctly (and Flat should always read 0 as discussed in the paragraph above).
and how you define "flat"? You`ll always have some altitude change on segment so you`ll still have to define some declivity area. And if you define interval +-1%, what you`ll do with parts -5% to -1% and +1 to +5%?
anyway you`re correct that `0m` should be much better
and how you define "flat"? You`ll always have some altitude change on segment so you`ll still have to define some declivity area. And if you define interval +-1%, what you`ll do with parts -5% to -1% and +1 to +5%?
anyway you`re correct that `0m` should be much better
Is the "flat" issue when e.g. elevation within a segment has increased
so slowly than the declivity is less than 5% and hence no change in acumulated
"uphill", but still the first and last point differ with several meters, then how
should that be counted? Do you accumulate these small changes into the
"flat" number, just that they are not qualified to be defined as uphill/downhill?
We should also remember that the 5% (was 2% a long time ago, right?) is
there to avoid meaningless accumulated small uphill/downhill changes
because of GPS inaccuracy.
If my understanding above is correct, then the Flat/Elevation number starts
making sense the way you have it today. May be it was only me then, but this
was not very obvious. But the more I think about this new way, the more it
makes sense to me (if I got it right now).
Do you calculate the declivity between consecutive points? If yes, it sounds like
a longer `time interval` and a longer `distance interval` would mean higher
accuracy. since longer horizontal difference as well as larger vertical
difference means that GPS inaccuracy becomes less significant?
What about my Total/Elevation item above?
yes you understand correctly in first paragraph. You have to think about it, not just to reduce some GPS noises. When you`ll move fast, then relative altitude will be correct but you move a long distance in low time. So when you`ll move 200km/h, it`s more then 50m/s. So when you`ll have recording every 2sec, then altitude change 4m/100m will still be marked as flat. Is this wrong?
Ah now I see you wrote about it in last paragraph. Yes you`re correct.
To make it "more precise", there should be not three ranges (> 5%, between, < -5%), but for example 5 or 7 ranges. >5%, 2%, between, -5%. t place for mistake I think
It seems you now have the best possible compromise between altitude correction options, filters and criteria for uphill/downhill/flat accumulation. Your latest implementation creates uphill/downhill data that make sense and hence are useful and of interest.
Only one small thing: check out the Total/Elevation field - it is not the sum of the three fields above (with absolute values) as you are saying it is supposed to be (refer your 2nd last reply and the 4 "Information" examples in this thread)
Thank you very much for these great improvements!
I still think it is :). Take example. Recording is every 150 metres. Lets say altitudes 100, 110, 115, 125, 115, 120, 115 ok?
so changes are +10, +5, +10, -10, +5, -5
uphill will be in this case every value higher then 5% on 150m = 7.5m
uphill: (+10) + (+10) = +20m
downhill: -10m
flat: (+5) + (+5) + (-5) = +5m
total elevation is: (+10) + (+5) + (+10) + (+10!) + (+5) + (+5!) = +45m
as you can see, sum of uphill, downhill and flat, do not match total elevation. This is exact system I use in Locus now
Ok - understand. I thought Total = Uphill + | Downhill | + | Flat |.
So:
- Flat = sum of all non-up/downhill changes taking the sign into account
- Total = Uphill + | Downhill | + sum of all non-up/downhill changes ignoring the sign
Ok, that`s fine. Makes sense. Is useful.
Thank you for your patience explaining all these details!
Replies have been locked on this page!