This object is in archive!
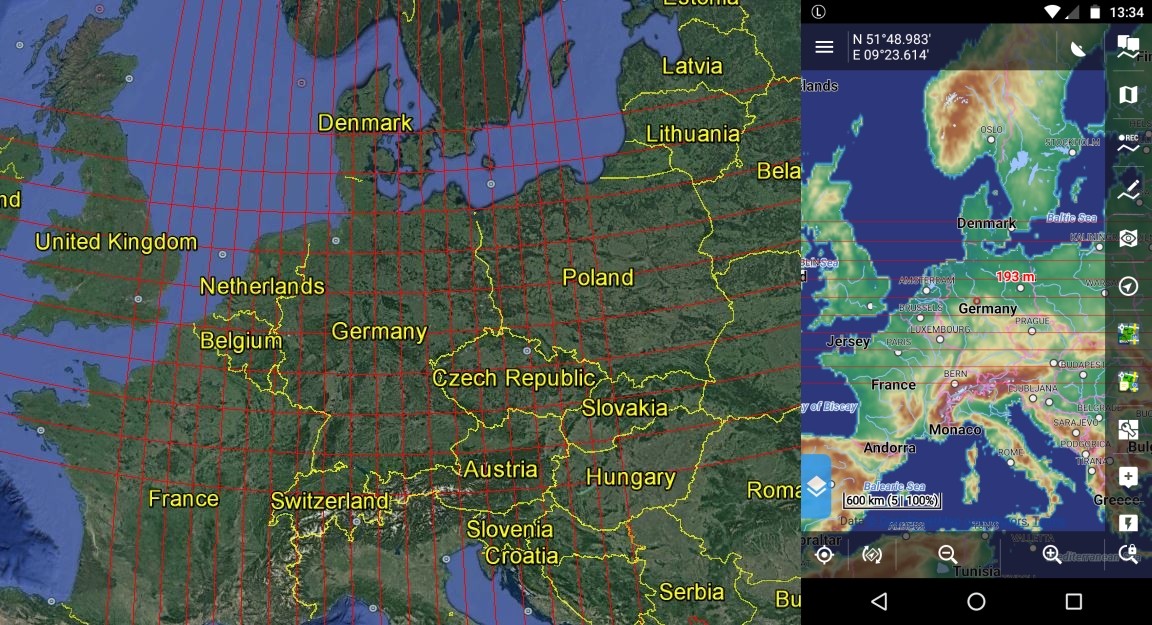
Mapitem grid display only lat lines
Solved
Happy new year to all !
Hello menion
i´ve built attached grid with QGIS
with GE it´s displayed well, but with Locus only horizontally lines are visible

Files:
grid_1deg.zip


 The same problem
Good day balloni, happy to You too :).
Without any deeper testing and just quick look into your file ... you use coordinates for latitude in range -90, +90. Anyway map projection that common raster maps use do not support pole regions (as you may see on the map itself). Is it possible for you to reduce generated grid to range -85, +85? Values over +-85 will cause troubles.
Hmm 15 votes after two years, not bad but ...
If you need a simple DACH 1deg grid..
If you need a simple DACH 1deg grid..
Replies have been locked on this page!