
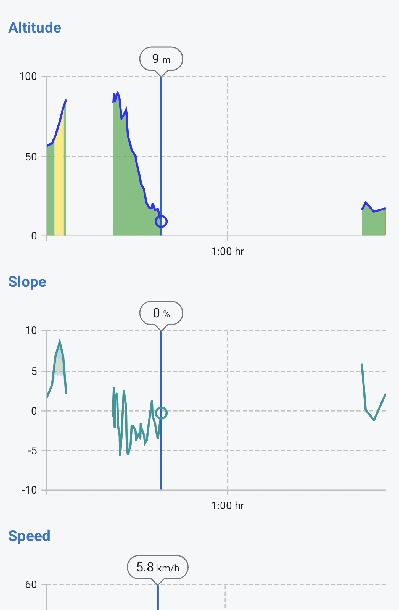
In LocusMap < 4 the exact distance was shown if you select a position on your track. LocusMap 4 shows a chart with X/Y axis and the distance is derivable from the X-axis, but not as exact value.
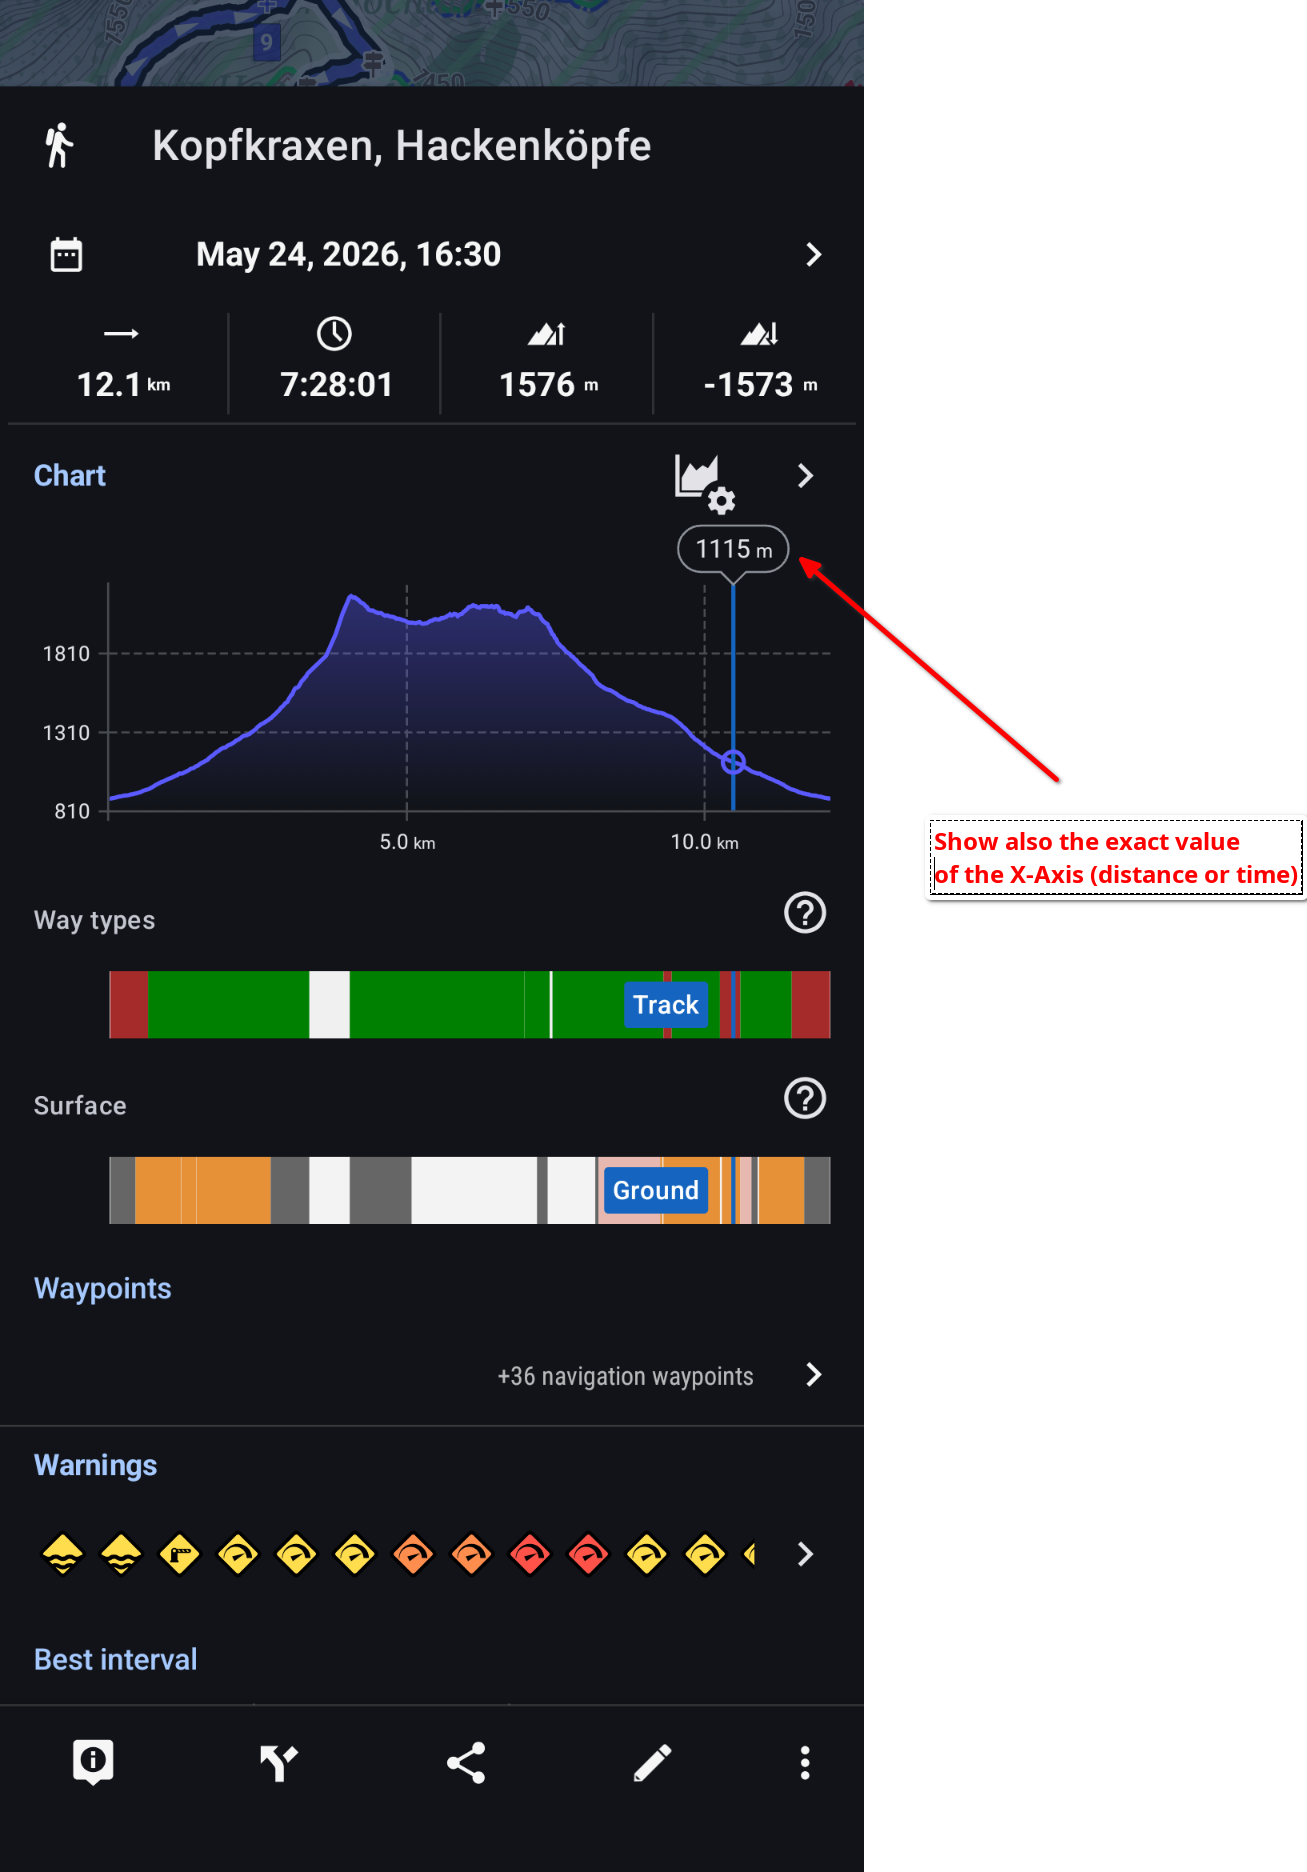
Please show the exact value of the X-Axis (distance or time; depends on what is selected) at the chart. See my screenshot.
 I like this idea
additional idea: display time-of-day in the tooltip - at present the only way to display the timestamp of any track point is via the "i" button - this alternative would be far more intuitive than tapping the "i" icon on the bottom toolbar & moving like a trackpoint editor
additional idea: display time-of-day in the tooltip - at present the only way to display the timestamp of any track point is via the "i" button - this alternative would be far more intuitive than tapping the "i" icon on the bottom toolbar & moving like a trackpoint editor
I understand the need for it, but I don’t want a bubble that’s so big it takes up a lot of space again. But it’s hard to find the perfect solution.
I understand the need for it, but I don’t want a bubble that’s so big it takes up a lot of space again. But it’s hard to find the perfect solution.
Good suggestion - we've added it.
When you tap a point on the track chart, the tooltip now shows the distance (or time, depending on the chart's X-axis) of that point alongside the elevation, slope and speed values. This will be available in one of the upcoming 4.34.x releases. The separate "time-of-day" idea you mentioned is noted but tracked separately, as it needs a bit more work.
Thanx
Thanx
Replies have been locked on this page!