
This object is in archive!
Allow Web Planner chart to be zoomed in-out
Completed
At present the online chart is only for the whole recorded track. Therefore with a long track much detail may be hidden, for example steep slope. It would be great if the chart could be zoomed in similar to RideWithGPS and the map synchronized.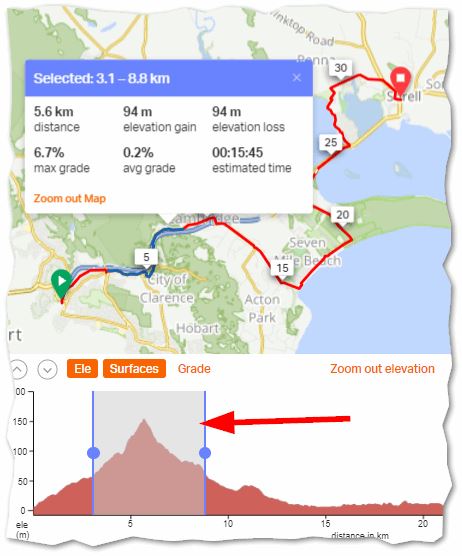
this topic is related to https://help.locusmap.eu/topic/26409-display-slope-at-point-of-mouse-on-chart
 I like this idea
Hi Andrew, thank you for your idea. Actually, you can zoom in right now only the controls are different. To zoom in/out you can use mouse wheel or zoom gesture on mobile phones ;).
Another interesting feature shown in RideWithGPS is possibility to select part of the track and visualise it on the map + display statistics. Is this something you wanted to cover in this idea or was mainly about possibility to zoom?
Replies have been locked on this page!