Limit gradient scale in chart to something reasonable instead of autoscaling to silly values

Andrew Heard shared this idea 9 years ago
Completed

Does it make sense to autoscale the chart gradient to +/-200%? In my case (screen capture below) these are very nonsense values that Garmin Basecamp has calculated; I have no easy/ convenient control over them. Maybe limit/ clamp any outlying values to no more than +/-90%, or maybe even ignore these values? What does a value > 90 even physically mean? Maybe it could be an import setting? Only then autoscale the remainder of the values. Thank you.
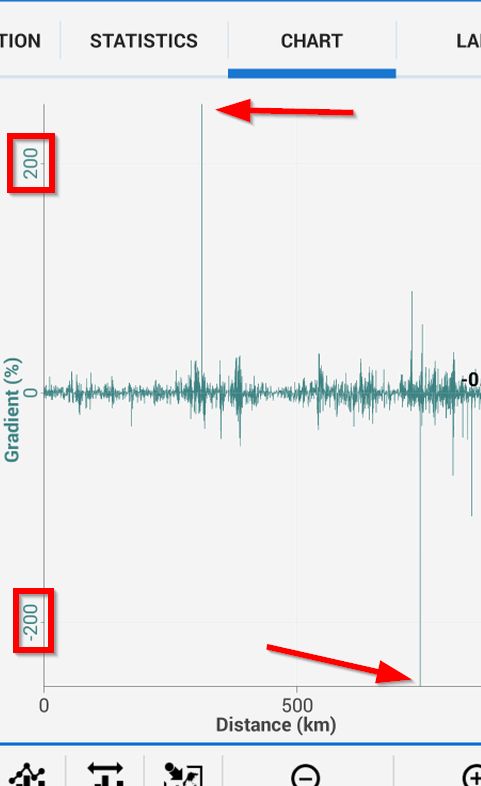
5fbb8acc4d8602131ce3a63325574db2

Replies (12)

photo
1

Based on this idea http://help.locusmap.eu/topic/improve-change-of-altitude-track-style-mode , I created a lot stronger filter for gradient to eliminate huge jumps based on even a small change of altitude on really short distance.


You'll see in next version, but I believe it will be a lot better now.

photo
1

Thank you - yes it looks a lot better now in 3.7.0.

photo
1

Perfect, glad to hear it.

photo
1

I just created a new track with 3.13.0/ BRouter, and mainly with fast bike profile - see attached, all normal process, but there are 3 huge negative spikes in the gradient which make the chart unusable - gradient -400% - I don't think possible (!). I won't follow that route on my bike over the cliff. It would be an additional improvement to completely ignore these impossible values (as I originally suggested) before any filtering step.

7eff92395721f0083e271bb486e395c7


PS. I had to add ".txt" to file to be accepted. Do you have any control over which file types are accepted? Surely a GPX file is a reasonable file to upload, and shouldn't need to resort to silly ".txt" trick to fool the website into uploading. Maybe confusing for other forum users too.

photo
1

Well and what you expect Andrew when computed track force you to jump 7 metres :).


Check line 3189 in file (14.25 m) vs next 3192 line (7.5 m).


And attachments - I!m aware of this problem, have to write to developers of this system what to do with it.

photo
1

You would have to agree the value of -400% has made the gradient graph totally useless to view. This is not an imported track where an argument could be mounted that all elevations must be accepted, but a track created by BRouter. A value of -400% is about -75 degrees. For a fast cycling profile this is clearly a bogus value. As I already said I'd expect/ hope these values to be ignored prior to the filtering step. Yes I fully understand a 7m step change has caused this bogus value.

photo
1

Andrew, I absolutely agree that such value is total nonsense for bike ride. Anyway you cannot expect that Locus should automatically ignore such values. What about cases when such value make a sense and it is expected value?


My practice is, that when I download any track with such crazy values, I then use function "Fill altitude" that for me in all cases fix incorrect altitude values in any track.

photo
1

>Anyway you cannot expect that Locus should automatically ignore such values

it could ignore such values in situations where it knows they are nonsense, but not to pursue this impossible dream further because...


...I've never used the "Fill alitude" function before. Thanks a lot for making the suggestion. That's a reasonable compromise. The spike reduced from -400% to -30%, and now I can see Y-axis detail for the gradient.

photo
1

Both Locus and Brouter use SRTM3 altitude data based on 90x90m space shuttle radar survey.

Everybody who uses these data should know there are many SRTM artefacts. Some are just data errors, and some of them are corrected. I supose there may be more SRTM3 versions, with different error correction progress. Also, some software may use SRTM data or track altitude filtering.

But some artefacts are related to fact how terrain features affect averaging of 90x90m radar altitude data. Sources of artefacts causing sharp SRTM altitude jumps are mainly:

narrow valleys, rivers, forest passages, urban areas, tunnels, bridges.

That is the reason why Brouter uses 10m altitude hysteresis filter, that is filtering out many, but not all artefacts, as it is a trade-off between filtering and distorting.

Once can have 20-30 m artefact jump in few metres, if you review SRTM altitude profile of a route you are familiar with.

photo
1

I now have a phone with a pressure sensor, and testing shows the altitude accuracy is far greater, far more reliable, far closer to known elevations on a topological map. However on a recent 600km ride I again experience a single track point which totally skews the gradient graph with silly autoscaling - gradient less than -150% ! Unlike previous phone where it may made sense to filter a track, I don't think this should now be necessary.

0d9294aae5ddfdbb09a6e13e75e40c88

GPS track at - https://drive.google.com/open?id=1aQ-HbrmGdySpIrr4lWUmFqaGs04hbC1Z

I eventually find this single bad track point using Garmin Basecamp point #20078 has zero metre leg distance. 52f259411714e7644274c2dfae4bfc1c


When I deleted this point and re-imported into Locus, the gradient chart is more reasonable -10% to +5% gradient. Unlike previous discussion is it therefore reasonable to ignore points with leg distance = 0m?

I note there is an abrupt jump in elevation from -7 to -15m but it appears this is not the cause of the gradient spike.

Locus Pro 3.32.2 GPS settings:

  • optimize GPS values
  • use pressure sensor
  • light filter

photo
1

Just a few versions ago I added this condition: compute gradient only in case of non-zero distance. Anyway seems here distance (leg) won't be exactly 0m, but something close to this. Hmm, I'll try to set this condition to 0.25m as the minimal distance (for real slow-walkers). This should help here.

photo
1

Thanks Menion. Will I be able to check/ verify/ notice any change with this existing track chart when the new Locus version is available? Or will it only affect newly recorded tracks?

photo
1

Chart is always generated as new, so changes in this will affect the chart immediately.

photo
photo
1

There is perhaps possible, in case of longer trip stop with paused logging and drifting pressure ( easily equivalent to 20 alt meters per hour for barometric altitude) , that subsequent points at resumed logging create a sudden change in supposed altitude.

photo
1

Libor - I just checked the map - indeed the 0m gradient spike occurred at a location where I was off the bike for 10 minutes although I didn't pause track recording, so the pressure should have only varied very slightly in that time.

photo
1

Not even autopaused due constant location threshold ?

photo
1

Correction - on closer observation I was not even stationary at the time of 0m glitch. The spike occurred about 500m before this point; I was riding at ~15km/h at this specific track point along a flat road. So no explanation from physical reality.

photo
1

Hmm. But in spite of altitude having barometric accuracy, position has GPS accuracy. In case one get for proper elevation change too short distance change, the result is a slope spike.


This is the reason an accurate barometric altitude may provide more noisy gradient profile,

compared to SRT based profile.

because

photo
1

Thanks Libor but certainly in my recent testing with my SRTM data, the pressure sensor has been far better. With the SRTM grid in places where the road traverses hilly terrain the altitude as estimated with SRTM data can be wildly inaccurate.

photo
1

Hi Andrew.

You may have misunderstood me.


The barometric altitude profile is indeed much better than SRT based one. But for the altitude alone. If the gradient is considered, its calculation is affected by GPS position error.


Purely GPS based gradient is affected by both position and altitude error.


GPS/SRTM based gradient has the least error of all three, as the local errors for altitude and position are correlated and partially cancel each other.

photo
photo
1

Hmm this is very good point. And quite hard to solve I think. Any ideas? Compare by time needed to travel leg? Not ideal for some climbing activities :).

photo
1

What about some deviation threshold check, the value being overwritten by a suitable interpolation if the threshold is triggerred ? Like to compute running standard deviation with threshold somewhere between 2-3 sigma ? Just thinking.

photo
1

P.S.: Or, for the chart, to run statistics and use e.g. 3 sigma scale for the gradient values, cutting out outlyers.

photo
1

The chart is already heavy filtered. My algorithm is based on making the weighted average from before and after 250 meters (or nearest 10 points) around the point, where in case of the slope, is used the strongest parameter that should throw out all these crazy values.

Anyway, I've added your tip to my private notes related to this topic, thanks.

photo
photo
1

Note that 20m/hour is typical value lasting many hours before a warm front. Before and after a cold front, the rate can be several times higher.

, Even if duration is much shorter.

Edit: what about to interrupt calculation of gradient at paused,autopaused, stationary like state? It could be used an Interpolation instead. It would eliminate such a jumps.

photo
1

Yet another example of invalid elevation measurement attached. New Samsung phone, nothing extraordinary. See below the second track point dips by 32 metres. The 3rd & subsequent track point elevations stabilize around correct ~213m. I don't see any chart heavy filtering - the gradient is displayed as -60%. Backstory to this track record: exit house, turn on phone, turn on Locus (settings: auto track record, GPS enabled at start), tap Satellite icon-button, wait for GPS to lock (~20s), ride, enjoy.

<trkseg>
<trkpt lat="-42.981888" lon="147.180609">
	<ele>206.80</ele>
	<time>2018-11-07T00:25:43.000Z</time>
	<course>162.600</course>
	<pdop>7.00</pdop>
</trkpt>
<trkpt lat="-42.981939" lon="147.180647">
	<ele>172.70</ele>
	<time>2018-11-07T00:30:22.000Z</time>
	<course>200.000</course>
	<pdop>4.00</pdop>
</trkpt>
<trkpt lat="-42.982110" lon="147.180865">
	<ele>213.65</ele>
	<time>2018-11-07T00:31:13.000Z</time>
	<course>114.800</course>
	<pdop>4.00</pdop>
</trkpt>

photo
1

I'm not convinced this topic is completed. No comment from @menion on latest example? I don't see evidence of weighted average of nearest 10 points.


@menion "The chart is already heavy filtered. My algorithm is based on making the weighted average from before and after 250 meters (or nearest 10 points)"

@menion 3 years ago "I absolutely agree that such value is total nonsense for bike ride."


What if filter took into account the activity profile?

photo
1

Hi Andrew,

I just tried your GPX track from an older post and it looks quite well I think, so there definitely is a progress.

/47c27a4b7bb5306608daf730c40493e6


Three points you send before: what result you expect here? During 6 minutes, 3 points, almost no horizontal movement and 70 m vertical change? Crazy values for hike/bike movement. If you have full recording (GPX) with more points and result is still same, send me it here and I'll gladly check what happen in app, thanks.

photo
1

Thanks @menion - I've attached the whole GPX file. Note again the workflow - turn on phone, immediately run Locus (auto track record & GPS enabled @ start). Maybe the GPS needs more points to stabilize. This new phone has a pressure sensor and the elevation in general is far less noisy than previous phone, but I have seen with & without a pressure sensor. You said, many years ago, you would ignore some initial points to avoid any startup issue. Although I have a few other examples over the years where it is not just a startup issue.

>what result you expect here?

Yes crazy values (maybe just 1st two), but common phone, nothing special, I imagine it happens more often than people may realize. Would not be obvious unless you graph gradient. It is clearly crazy to a human so I expect/ hope here Locus could be more intelligent like a human too.

In this topic 3 years ago you said "Anyway you cannot expect that Locus should automatically ignore such values. What about cases when such value make a sense and it is expected value?" Could my suggestion to link the elevation filtering/ point rejection "logic" (for want of a better term) with the track recording profile be a way forward? If the profile is for a pilot, paraglider or rockclimber etc. then sure it is difficult to ignore such values. Maybe if the profile is for a road cyclist, Locus can make better assumptions that elevations can not jump by large amounts when the position changes by a small amount? The 1st 3 points are within 30m of each other, and there is a 34m change of elevation just within ~8m for 1st 2 points. Libor may be better thoughts to an actual filtering algorithm and/or whether individual points could be rejected.

photo
photo
1

@Menion ,

Do you filter the altitude points on the time scale, or the resulting gradient ? As time derivatives of noisy signals are much more noisy, it would make sense to heavily filter the gradient, instead of heavy filtering the altitude, that could damage real values.

photo
1

I filter both values. Little crazy is that altitude values are filtered and these values (filtered) are then used for computing of gradient.

Thanks Andrew for the file. All values look good except the start of track, as you wrote. I noticed the same issue on my device as well. It is generally not a problem of strength of the current filter. GPS just sometimes needs more time till it stabilizes. Interesting is that Locus Map currently ignores first 10 locations from GPS marked as "fixed" when you enable track recording. 11th location is the first recorded, so this should eliminate worst cases with invalid horizontal/vertical location values. Seems, still not enough sometimes.

So the solution?

Hmm my idea: analyze track right after track recording stop, compare with elevation values from HGT files and if they will match (means user moved on the surface), find and fix just these huge peaks based on HGT values? Most probably fix just values at the start of the track or after the pause in recording.

I'm sure, that Libor will have some really complicated sophisticated "signal-filtering" system for me. If so, maybe pointing me on some useful texts "how to solve similar use-cases" may help. Thanks

photo
1

sure, signal processing can be effective, but there are also simple ways.

One of practical simple solutions for first derivatives directly from original data is using coefficients for the 1st derivation for Savitzki-golay smoothing (SGM). SGM approximates a time serie by least square method by a local cubic polynom over a sliding set of point.

The point is, it results in just weighting of points around the given point by integer numbers and normalizing the sum..

For the 1st derivative, the gradient in our case, the weighting gets very simple. Typical range of used points is 5-25, i,.e. N = 2 .. 12

If 2N+1 points are taken, gradient at the central point isapproximated as:

g = ( -N * y(-N) - (N-1)*y(-N-1) .... -1 *y(-1) + +1*y(1) + ..... + N * y(N) ) / [ N * ( N+1 ) * h ]

where h is the point step interval.

if x = 0, 2, 4 , 6, 8 and y = 5, 6, 7, 9, 10

then appproximation of the gradient dy/dx at the central point x=4 is

( -2*5 + -1*6 + 0*7 + 1*9 + 2 * 10 ) / ( 2*(2+1) * 2 ) = ( -10 - 6 + 9 +20 ) / 12 = 13/12

In this example it is rather time gradient, the change of altitude with time, not the distance.

But as the altitude values come with 1s interval......

photo
1

I think the gradient based on HGT files is quite a safe harbour. the option to derive gradient not from GPS altitude, but directly from HGT file may be interesting, as it would be smooth. It could be on user to decide, which way to be used.

Also, it would give an agreement of planned and recorded tracks.

Sure, it would be applicable for special cases like climbing or air gliding.

photo
1

Correction:( wrong memory )

If 2N+1 points are taken, gradient at the central point isapproximated as:

g = ( -N * y(-N) - (N-1)*y(-N-1) .... -1 *y(-1) + +1*y(1) + ..... + N * y(N) ) / [ 2 * sum[1..N]( N^2 ) * h ]

where h is the point step interval.

if x = 0, 2, 4 , 6, 8 and y = 5, 6, 7, 9, 10

then appproximation of the gradient dy/dx at the central point x=4 is

( -2*5 + -1*6 + 0*7 + 1*9 + 2 * 10 ) / ( 2*(1+4) * 2 ) = ( -10 - 6 + 9 +20 ) / 20 = 13/20=0.65

In this example it would be time gradient, as the altitude values come from GPS with the constant time interval 1s, while the distance interval is variable. But we could easily calculate the gradient = time gradient / speed.

Time gradient 0.1 m/s and speed 10 m/s lead to gradient 0.01 m/m

photo
1

I did have an example from ~3 months ago where mid-ride there was a spike, but 95% of the time the spike is when Locus is 1st started, or when using pause/resume of track recording. Mostly I don't even check the gradient chart because is well known route & ridden before, so spikes may occur even more frequently than I thought.

Does "ordinary" HGT data have sufficient spatial resolution (30x30m I think) to help in your proposal? What about where the area is very rugged?

photo
1

For an illustrattion, I created a s testing slope 0.25 per point, with added noise with STDEV=1.0, i.e. like very up/down jumpy GPS based altitude slope.

Below is the table of filtering progress, providing the the average and stdev of omputed slope, given the N of the filter. On thebsecond row is the noise percentage, based on the slope stdev.


Screenshot-20181128-10-28-48

photo
1

you may try this Excel document on Office online ( only a browser is needed ).

( Read Only )

https://1drv.ms/x/s!AmTXM3zwkMZNgRDQabOMDmOiV5kc

photo
1

Thanks Libor for your suggestions & precise pre-prepared tool. I'll definitely check it next week (once we publish new version).

photo
1

The filtered value is the exact value of the 1st derivative of a cubic polynomial, used to approximate 2N+1 points via least squares approximation method.

For the filter of the strength N,

create array of the size 2N+1, with values

-N, -(N-1), ...-1 ,0, 1,...N of the weights.

The filtered value would be the scalar multiplication of this array of weights

and of the array of 2N+1 points values, divided by the normalisation constant.

The constant

Is the array of weights,

scalar-multiplied by itself.

Therefore,

Filtered_value = ( points . weights )/(weights . weights)

where . is array scalar multiplication.

photo
1

Another example today is attached. Elevation of 1st track point is 60m below expected value. I note <pdop> is very high 26 whereas normally far more precise (5 to 10). Maybe elevations with a pdop above some smart threshold should also be ignored? See here for PDOP info.

photo
1

Correction: The filtered value is the exact value of the 1st derivative of a quadratic polynomial, used to approximate 2N+1 points via least squares approximation method.( cubic one would have harder to compute values ).

Note that the Savitzki-Golay filter has its wikipedia page as well .

photo
1

Sorry Libor I haven't had a chance to check your filtering yet.

Menion - I have attached another file, and here is also a link to RWGPS. The Locus chart is scaled to +40% but I can see no gradient spike either in the Locus or RWGPS charts that are more than 8%. Also in reality there is no gradient more than 8%.

9f7af9d22851fa9315bafc888ce5f1ef

photo
1

Attached is another interesting example of track recording, and problems with invalid elevation. Elevation at 2019-01-20T02:11:39.000Z is 107m at lat="-42.484641" lon="146.710361". I enter a store for ~30 minutes. When I come back out the elevation is 94m, and it takes many minutes before it is stable again. I would assume this could be an issue for any Locus user.

photo
1

Andrew, thanks for the feedback. I've marked this topic in my TODO list. I just do not have time on this as there are currently more important tasks to do, sorry.

photo
1

That's OK. It was more of interest than anything more, that leaving track recording enabled while passing through tunnel or GPS black spot (eg. indoors) will possibly result in elevation discontinuity. I haven't had a chance to look at Libor's advanced filtering yet either.

photo
1

Here is a track from yesterday where the Locus chart has autoscaled the gradient -50%/+10% but I can find no spike within the GPX to explain this invalid scaling. When I zoom into the Locus chart I can't see any negative spike. The RWGPS chart shows more reasonable +/-10% scale. Any explanation?

4af3c1f672b4550c99ffd118fe20a6ec

photo
1

Nice ride ... may you attach here original GPX from Locus Map? It has to be something at the start (first few points).

photo
1

<trkpt lat="-42.981811" lon="147.180706">
	<ele>270.40</ele>
	<time>2019-03-13T21:57:41.000Z</time>
	<course>151.881</course>
	<pdop>13.00</pdop>
</trkpt>
<trkpt lat="-42.982041" lon="147.180706">
	<ele>238.83</ele>
You are correct - the 1st elevation was invalid. Usual story. I hadn't checked the GPX text, only zooming in visually but could not see reason. Not need to check further thanks.

photo
Leave a Comment
 
Attach a file