
This object is in archive!
Dashboard with graph
Answered
Hi, I've made a dashboard for cycling with a graph.
The graph displays the elevation of the whole route. See "graph zoom out".
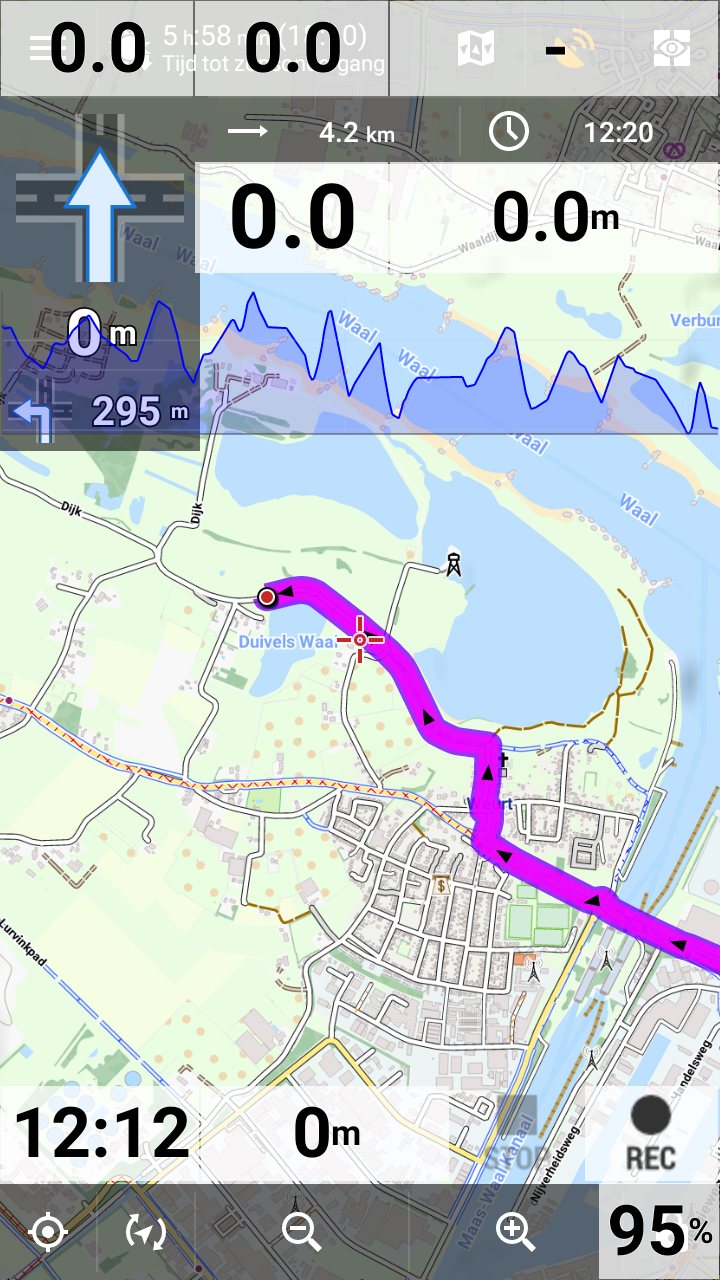
But when you start riding the graph zooms in and you can only see 100 meters or so from the route. See "graph zoom in". The elevation graph is of no use then because it shows only 1 meter up or down.
I'd like to see the whole route with elevation during navigation, so I can see where I am at a certain mountain climb (like the graphs you see on TV during a cycling race). Is that possible?
 The same question
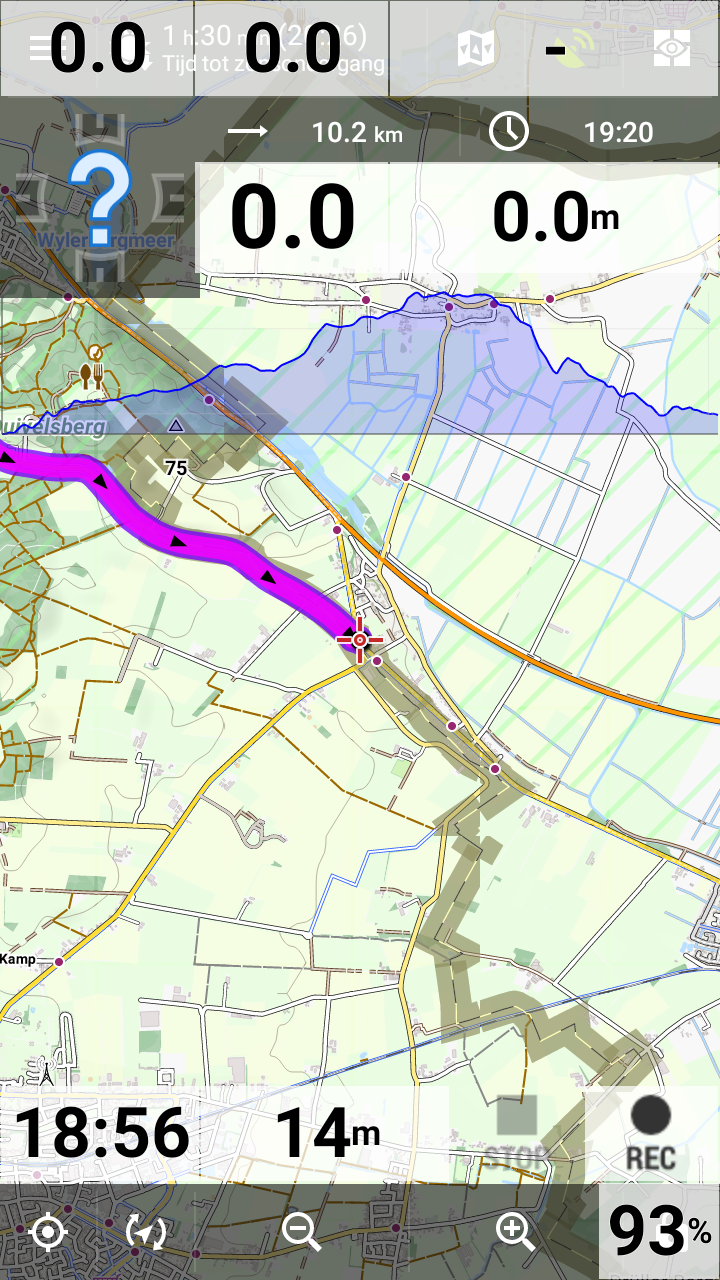
Hi Sjoerd,
the value "100 m" can be changed in the dashboard settings - open Dashboard editor > select dashboard you want to edit > tap the cell you wnat to edit > select Edit item > Max. visible range - adjust up to 5 kms > tap SET > tap "Save as" in the topbar menu > again select your dashboard and confirm overwriting.
Michal
Hello Michal,
Thanks for your quick answer.
I see I can adjust the max. visible range to even 20 km, so that helps a lot.
Is it possible that you change that setting to a max of 100 or 200 km? So that I can display the elevation of my whole route in the graph. That would be fantastic.
Sjoerd
Hello Michal,
Thanks for your quick answer.
I see I can adjust the max. visible range to even 20 km, so that helps a lot.
Is it possible that you change that setting to a max of 100 or 200 km? So that I can display the elevation of my whole route in the graph. That would be fantastic.
Sjoerd
Hi Sjoerd,
100 or even 200 kms displayed on a route elevation chart would not make any sense - such distance stacked on 6 cm of display would have no information value. 20 km is maximum.
Hi Sjoerd,
100 or even 200 kms displayed on a route elevation chart would not make any sense - such distance stacked on 6 cm of display would have no information value. 20 km is maximum.
Hi Michal,
Yes, maybe on flat or hilly terrain it has no information value.
But for cycling in the big mountains it certainly has value.
In the screenshot is a route of 70km in the French Alps. In the graph the whole route (elevation) is visible. In the first 40km the route climbs from 750 to 2050 metres.
The value of the whole route visible is in the fact that you can see where you are on the climb. In other words how much climbing you have to do. When the graph zooms in to 20km, you can't see that. So in the big mountains you lose information value when you zoom in.
Sjoerd
Hi Sjoerd,
such a long route continuously rendering elevation chart would cause too extensive usage of mobile processor, battery drain and possible crashes due to insufficient system performance. 20 km is maximum. Thanks for understanding.
Michal
Hi Sjoerd,
such a long route continuously rendering elevation chart would cause too extensive usage of mobile processor, battery drain and possible crashes due to insufficient system performance. 20 km is maximum. Thanks for understanding.
Michal
Hello Michal,
Ok, that's too bad. I still think it would be a very nice feature for cyclists.
When the whole same chart (70km route, 70 km chart) is visible all the time of the route, is that still a problem for rendering?
I see other cyclists have the same question. For example in this topic: https://help.locusmap.eu/topic/navigation-diagram-1
Sjoerd
Hi Sjoerd,
I discussed this with Locus author and developer and he says the whole chart would be a problem for rendering.
Michal
Hi Sjoerd,
I discussed this with Locus author and developer and he says the whole chart would be a problem for rendering.
Michal
Replies have been locked on this page!