
CPU time increase after long runtime
In the last weeks I did some lonely MTB trips and notice a decrease of battery runtime from 17 hours to 12 hours screen on time compared to my Android ROM benchmarks, by using mostly only my high contrast dashboard with low LCD brightness.
I thought my battery was already worn out because I did modify my firmware to skip android auto shutdown and keep draining battery until the protection circuit cuts the power to get ~5% more runtime. But I could reproduce my 17 hours time in a controlled environment and even better, I could measure cpu time differences between my test case and a more real usecase by feeding the gps simulation with my real data.
First of all, there is a difference between receiving 36.000 GPS points from roughly same location and 36.000 GPS from different locations.
- Different positions do force map render time
- Different positions do rotate map
- Different positions do increase recording track length
I could fix the first 2 points
- disable map rotation during dashboard usage
- disable center position during dashboard usage
But after benchmarking this improved setup I found out that guidance does take extra cpu cycles and a fresh started locus maps does use much less cpu cycles than an instance with already some hours of runtime. I'm not sure what's the reason, because I can't execute many long-running use cases.
Don't blame track recording right now, I didn't prof it so far, but at least I found out that something is keep increasing battery drain over time. Could be a reason because calculating 36.000 points is more expensive than calculating 3.600 points.
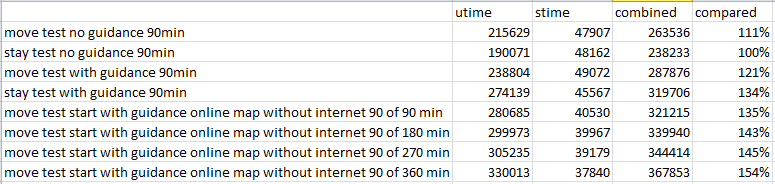
I did four 90 minutes tests with closing locus process after each run and one 360min test with 4 segments. The 360 minutes run did keep increasing cpu times after each 90 minute segment
More context for the Data:
- I did use a 90min long nmea file with nearly static position for the stay tests
- I did use a 15 hour long GPX track for guidance
- I did use a 90min long cycle ride nmea file for the move tests (does match to the first 10% of the gpx track)
- I have sensor debug logging allways enabled to keep high precision pressure measurements with 5Hz, so my cpu times are maybe a bit higher then usual
- All tests are done on a v3 vector map, except the online tile map test
- measurements was done with /proc/[pid]/stat
I could send you all my Testdata (2 nmea files and the gpx track) via email if you like.
At the end of week I try to find out what happens without track recording and what happens without sensor debug logging.
 The same problem
After 108 hours of testing I found the following results:
Vecor Map Rendering is amazing, your cache is working really well, if you just follow GPS and don't scroll around, there are basically no cpu cycles used at all. Its even 1% better than empty map :D
A custom Dashboard with 4 values and a elevation chart does take 9% of the overall locus power consumtion.
Track guidance does usually take 7% of locus power consumtion, only if the track is some kilometers away, it will take 10-15%
Track recording is the fuction with increasing cpu time cycles, it will take 5% of locus power consumtion per hour, after 1 hour it is already as expensive as track guidance and after 2 hours it is even more expensive then a full blown dashboard. The option to view only the last 1000 points instead of the whole recoring doesn't save any cpu cycles (or less then 1%)
The most processing is done in handling GPS positions. 85% of Locus processing time is used to update everything after getting a new GPS data.
If gps is disabled, locus does use only 15% of it's usual power draw. But on my old phone this is still 5% of the whole CPU capabilities just for idling. This sounds suspicious too, because other apps does use less power in idle state.
If you have everything enabled, it will look like this and will drain your battery by 157%, which does match to my observation where I found out that I did lost 1/3 of my battery runtime some were.
To put these value into an context, baseline test will use 40% of the first core of my quad core CPU. And all features will take 63%.
Android power management does a good job to put all threads on CPU0, because CPU1,2,3 did only use 1% of total system cycles.
Hello Falco,
this is really impressive testing and a very serious topic, thanks for this!!
A small problem in code may over time grow to something like this, so I'll for sure try to help with solution.
So your setup for the test:
Miss anything?
Quite a lot of parameters at once. Should be possible to do a 90 min tests:
With this, it should be possible to detect service that has a high impact and on which I may focus. In case of a lack of time on your side, let me know.
It should be also interesting to compare an online/raster maps to vector map base-line ... maybe in a free time ;). In the case of vector maps, it will highly depend on zoom level & movement (so generally how often app will have to create new map tiles).
I can confirm with some notes
I will create the following tests:
I guess I need to test them twice because even with 90minutes I have some unknown results. Stay vs move test was 10% better without guidiance but with guidicance it was the other way arround.
means 8 times 6 hours, sounds like fun :D
I will mix in a v3 map rendering test (enable map rotation and enable center gps and fixed zoom level) because map rendering should be more expensive then track recording. If it isn't then we may have incredible map rendering or awful track recording ;)
Next week I have another useless lonely week of vacation at home. I hate myself for putting so many holidays into Q2 because now I can't do anything with this free time except for pushing unusual locus use cases :D
Next week I have another useless lonely week of vacation at home. I hate myself for putting so many holidays into Q2 because now I can't do anything with this free time except for pushing unusual locus use cases :D
On today's cycle trip I did a run without map on my dahsboard screen without navigation and without recording (I do extract the recording from the sensor debug data)
And it did perform like on my test bench, maybe even better (of course, without features it should be better than on my test bench with enabled features but no movement). Today it was 32% Battery use in 7:15 hours. Would be 17 to 21 hours screen on runtime for the full battery.
My Setup target is arround use only 80% battery on a 15 hour trip (screen and locus off during lunch) to have 20% charge left for my bike light to get home. I did calculate based on my benchmarks (no movement but all features) that this goal is easy to achive.
Good to see that at least with disabled features it will be no problem at all. Next week I try to figure out which feature is eating the cpu cycles only during movement :)
By the way, ist it possible to select empty map in the preset feature? I use a non translucent dashboard preset as a cycle speedometer.
Almost done,
So far I can say the following
Track Recordng: 1-2% initial and then stacking CPU Time raise by 7% per 90 Minutes
Guidance: constant 7% CPU Time if next point is nearby and 16% if next point is ~10-20km away. That distance dependency is the reason for old unexpected stay test with guidance result, because the next guidance point was 200km away on my stay test nmea file and did eat alot of cpu cycles, maybe 30%
So we could take a look why track recording is keep increasing cpu time useage. You do have an toggle in recording setting to show only the last x points to improve performance. Should I try the effekt of this? It may have no effekt if it is just for map rendering.
After 108 hours of testing I found the following results:
Vecor Map Rendering is amazing, your cache is working really well, if you just follow GPS and don't scroll around, there are basically no cpu cycles used at all. Its even 1% better than empty map :D
A custom Dashboard with 4 values and a elevation chart does take 9% of the overall locus power consumtion.
Track guidance does usually take 7% of locus power consumtion, only if the track is some kilometers away, it will take 10-15%
Track recording is the fuction with increasing cpu time cycles, it will take 5% of locus power consumtion per hour, after 1 hour it is already as expensive as track guidance and after 2 hours it is even more expensive then a full blown dashboard. The option to view only the last 1000 points instead of the whole recoring doesn't save any cpu cycles (or less then 1%)
The most processing is done in handling GPS positions. 85% of Locus processing time is used to update everything after getting a new GPS data.
If gps is disabled, locus does use only 15% of it's usual power draw. But on my old phone this is still 5% of the whole CPU capabilities just for idling. This sounds suspicious too, because other apps does use less power in idle state.
If you have everything enabled, it will look like this and will drain your battery by 157%, which does match to my observation where I found out that I did lost 1/3 of my battery runtime some were.
To put these value into an context, baseline test will use 40% of the first core of my quad core CPU. And all features will take 63%.
Android power management does a good job to put all threads on CPU0, because CPU1,2,3 did only use 1% of total system cycles.
Hello,
I've yesterday wrote own testing system in the app that is able to execute defined steps & measure CPU and battery usage over time. Based on your tests, I've focused on track recording and I think I've found an important thing.
The problem is connected to drawing a recorded track on the map and the number of points this track has. Nothing more is involved here. If you turn the screen off, or just display other than the map screen, you should get constant CPU usage.
When the track is draw, it always needs some preparation: initialization of locations, some optimizations, preparation of colors for special styles etc. Problem is, that if track changes (like new recorded location), this all has to be done again. And not only the change, but completely from scratch. In the case of more points, it becomes more and more CPU intensive operation.
Not a very easy task to be true, but definitely solvable. For now, I suggest mainly decreasing recording frequency, which may have a significant impact. I!ll try to find more time on this during May and let you know about some news.
EDIT: at least some improvement to start > found extra not-needed double-refresh of track on the map, should help, fixed.
I did a single Test run with 6s or 1000m, this setup will update every 5s
But instead of
I got
I did expect something around 25 times less CPU time increase, because 5 times less recalculations * 5 times less track points.
9% increase / ~10-20 times more efficient = 0,9%-0.45% increase every 90 minutes
But instead 0,45% I got 3% increase every 90 minutes for a 6s or 1000m recording. And the change from 1s or 1m to 6s or 1000m did add 24% more cpu time which can not be true, I do currently run a verification run with
1s or 1000m
and another one with 1s or 1s
this does look like there is another recording related process which will be triggered more often then 5s, because if the recording processing would be triggered only every 5 secounds I would at least find a 5 times improvement: 9% cpu time raise / 5 times improvement = 1,8% but I got 3% increase with 5 times less points and 25 times less recalculation effort.
But the good thing is, if you look into the excel file, recording is the only process which will add up cpu time, all other usecases did result in very consistent cpu times, not a single percent point difference between first 5 minutes and the last 5 minutes after 9 hours runtime on the other features. This is a great result.
Hello Falco,
thanks for the tests, but I really suggest waiting on the results of some of my experiments and not wasting your time on it.
I made own small testing system with an option to speed up (optimized) NMEA simulation by 10x. And here are results.
Consider all times as 10x faster, so whole single test should otherwise tool 30 hours!
Setup: emulator in AirPlane mode, all possible services disabled
Steps:
Chart
Notes
Well, I'm looking forward to confirmation on your side with next Beta version ;)
Replies have been locked on this page!