
Improve dashboard elevation chart / ClimbPro
For road/mountain biking, it would be nice to have a dashboard chart which shows the elevation profile for the next n kilometres with more detail.
Currently the elevation profile, let's say for the first 5 km of a 70 km track, is nearly even, when the biggest part of the total elevation comes somewhere later.
So the 5 km preview is rather useless, although there are as well short, but steep climbs.
So the improvements should comprise
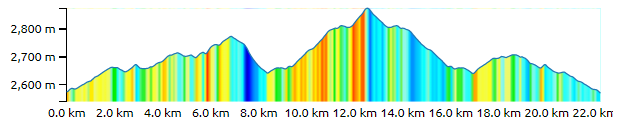
- scale the elevation line to the height of the chart cell
- indicate the slope with colours beneath the line.
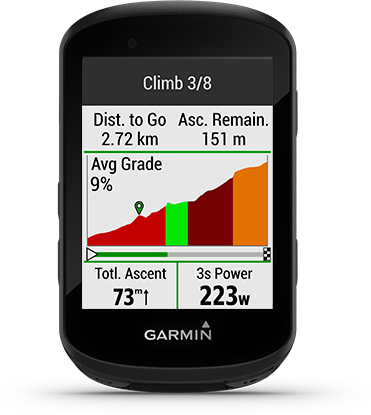
- optionally analyze the track, identify remarkable climbs (configurable) and notify, when one is ahead.
This is more or less a standard feature of state-of-the-art bike computers as for example the ClimbPro feature in Garmin Edge.
There have already been a lot of requests in the past regarding the navigation chart. So quite a lot of people would welcome such a feature
https://help.locusmap.eu/topic/skalierbares-h%C3%B6hendiagramm-im-dashboard
https://help.locusmap.eu/topic/how-to-set-custom-chart-color
https://help.locusmap.eu/topic/add-slope-percentage-in-elevation-chart-on-selected-point
https://help.locusmap.eu/topic/more-configurable-dashboard-altitude-graph
https://help.locusmap.eu/topic/dashboard-chart-scaling-of-y-axis
https://help.locusmap.eu/topic/30823-dashboard-navigation-chart
 I like this idea
Is there any feature planned for this request?
Is there any feature planned for this request?
Replies have been locked on this page!